• Designs
  • MCP
  • Pricing

SwiftUI designs with the code. Copy them, download them, or build with them in Claude, ChatGPT and Cursor.

Swifolio

  • Designs
  • MCP
  • Pricing

Categories

  • Effects & Animations
  • Buttons & Controls
  • Cards & Carousels
  • Tab Bars & Navigation
  • Scroll Lists & Grids
  • Onboarding & Auth

Account

  • Sign in
  • Saved designs
  • API keys
© 2026 Swifolio. Designs inspired by other apps are original code, not affiliated with or endorsed by those apps' owners.llms.txtBack to top ↑
All designs

Charts Progress & Time

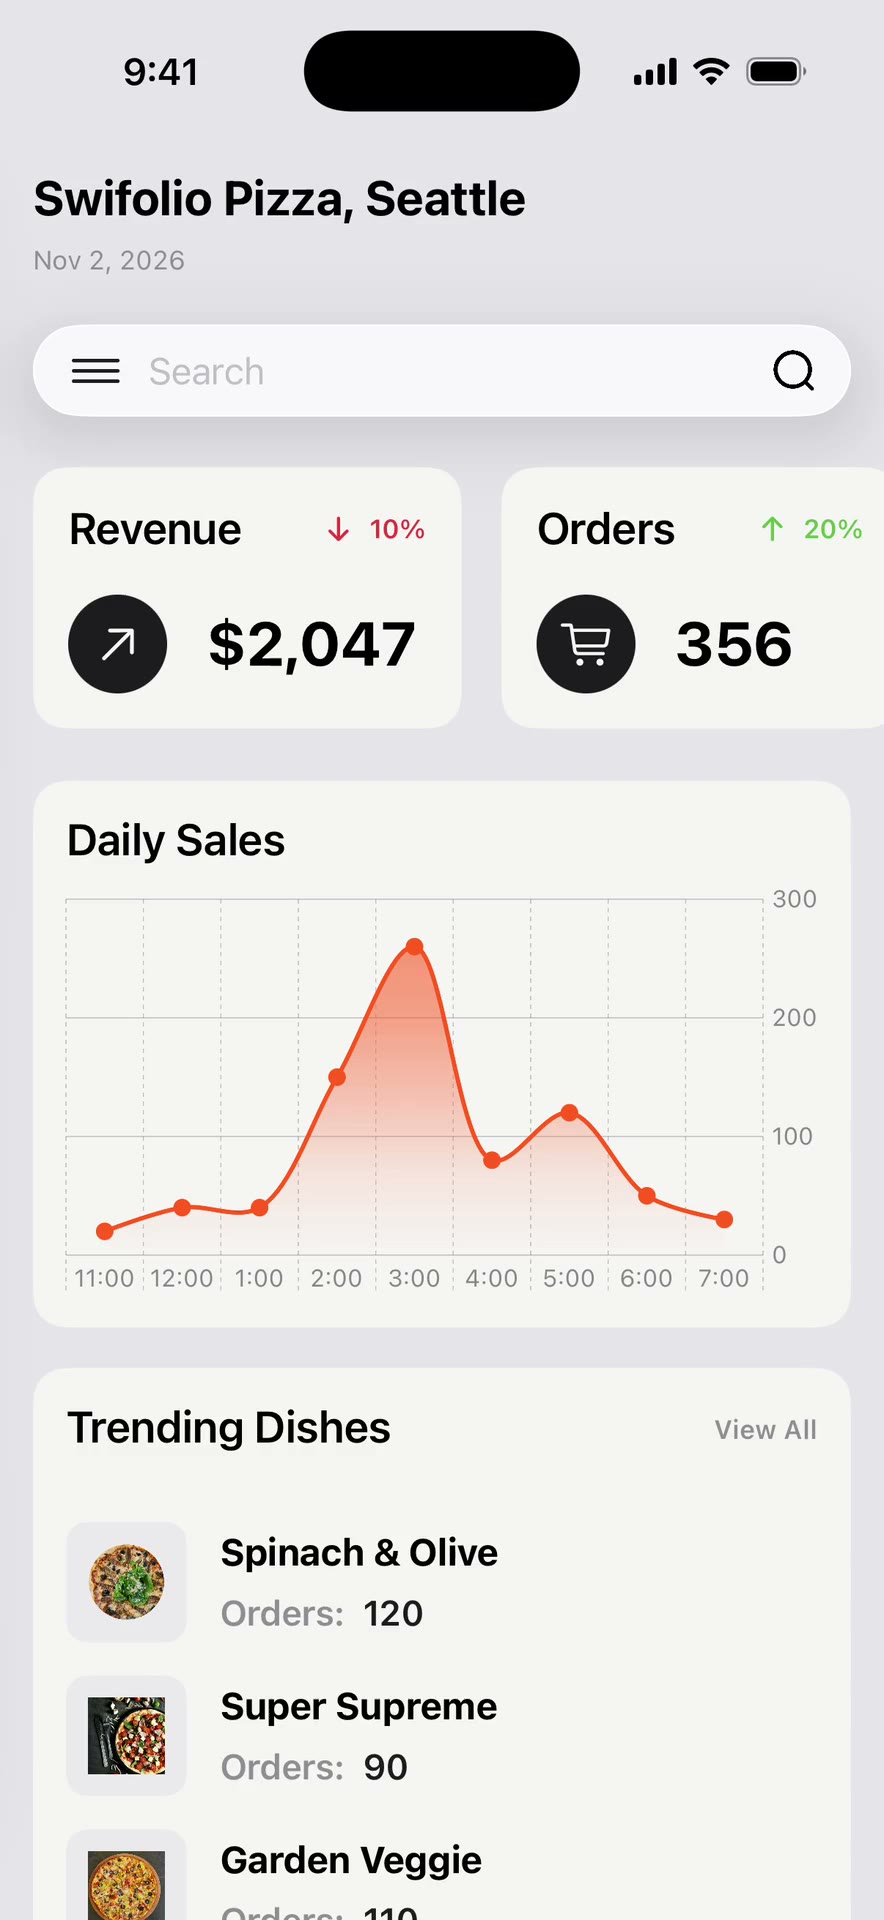
Swift Charts Analytics App

  • iOS 18+

Preview

About

Analytics bar chart you drag across to see each hour's count, and it flips to an area line.

Requires
iOS 18+
APIs
GeometryReader, Liquid Glass, NavigationStack, Charts
Tags
swift, charts, analytics, app, interactive, bar, and, line, chart, minimal, glass, drag, tap, the, stats, card, fitness, sales, dashboard

Code

The code for this design comes with Swifolio Pro

$9.99/mo or $99/yr unlocks every design's source, .zip downloads and the MCP for Claude, ChatGPT and Cursor.

Get Pro

More like this

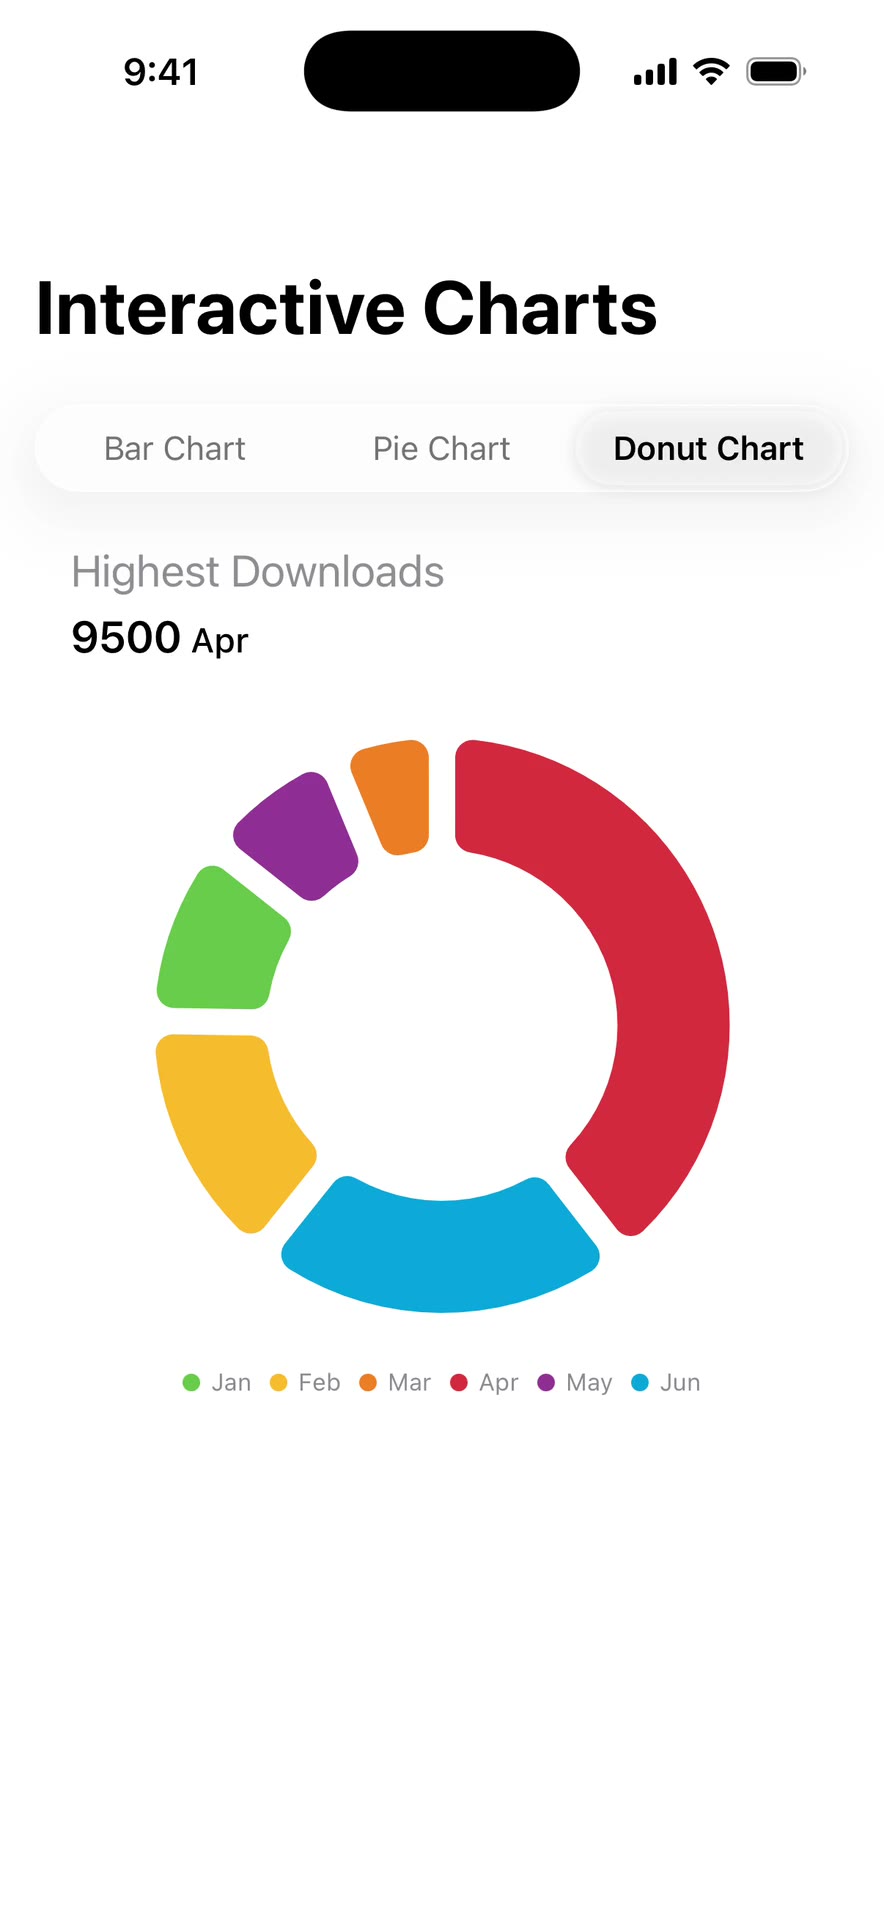
Interactive Pie & Donut Charts

Interactive Pie & Donut Charts
Charts Progress & Time

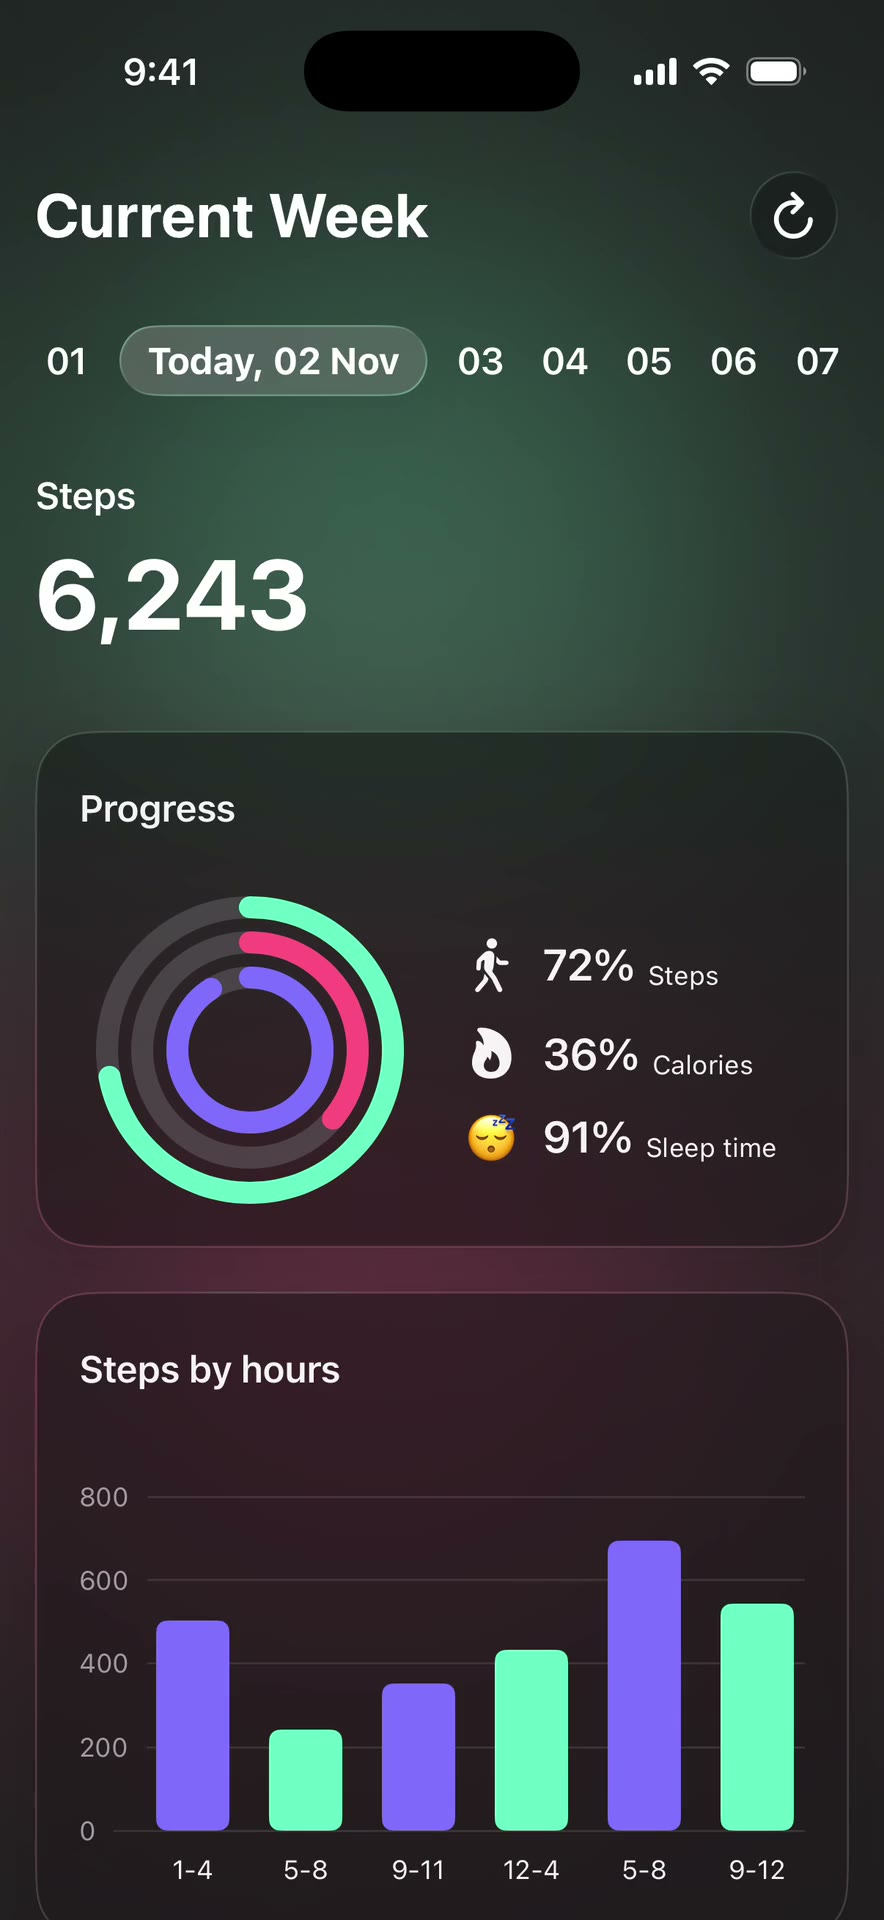
Minimal Fitness App Animations

Minimal Fitness App Animations
Charts Progress & Time

Responsive Adaptive UI – MVVM – Part 3

Responsive Adaptive UI – MVVM – Part 3
Data & System APIs