All designs
Charts Progress & Time
Analytics Page – Draggable Bar Graph
- iOS 18+
Preview
About
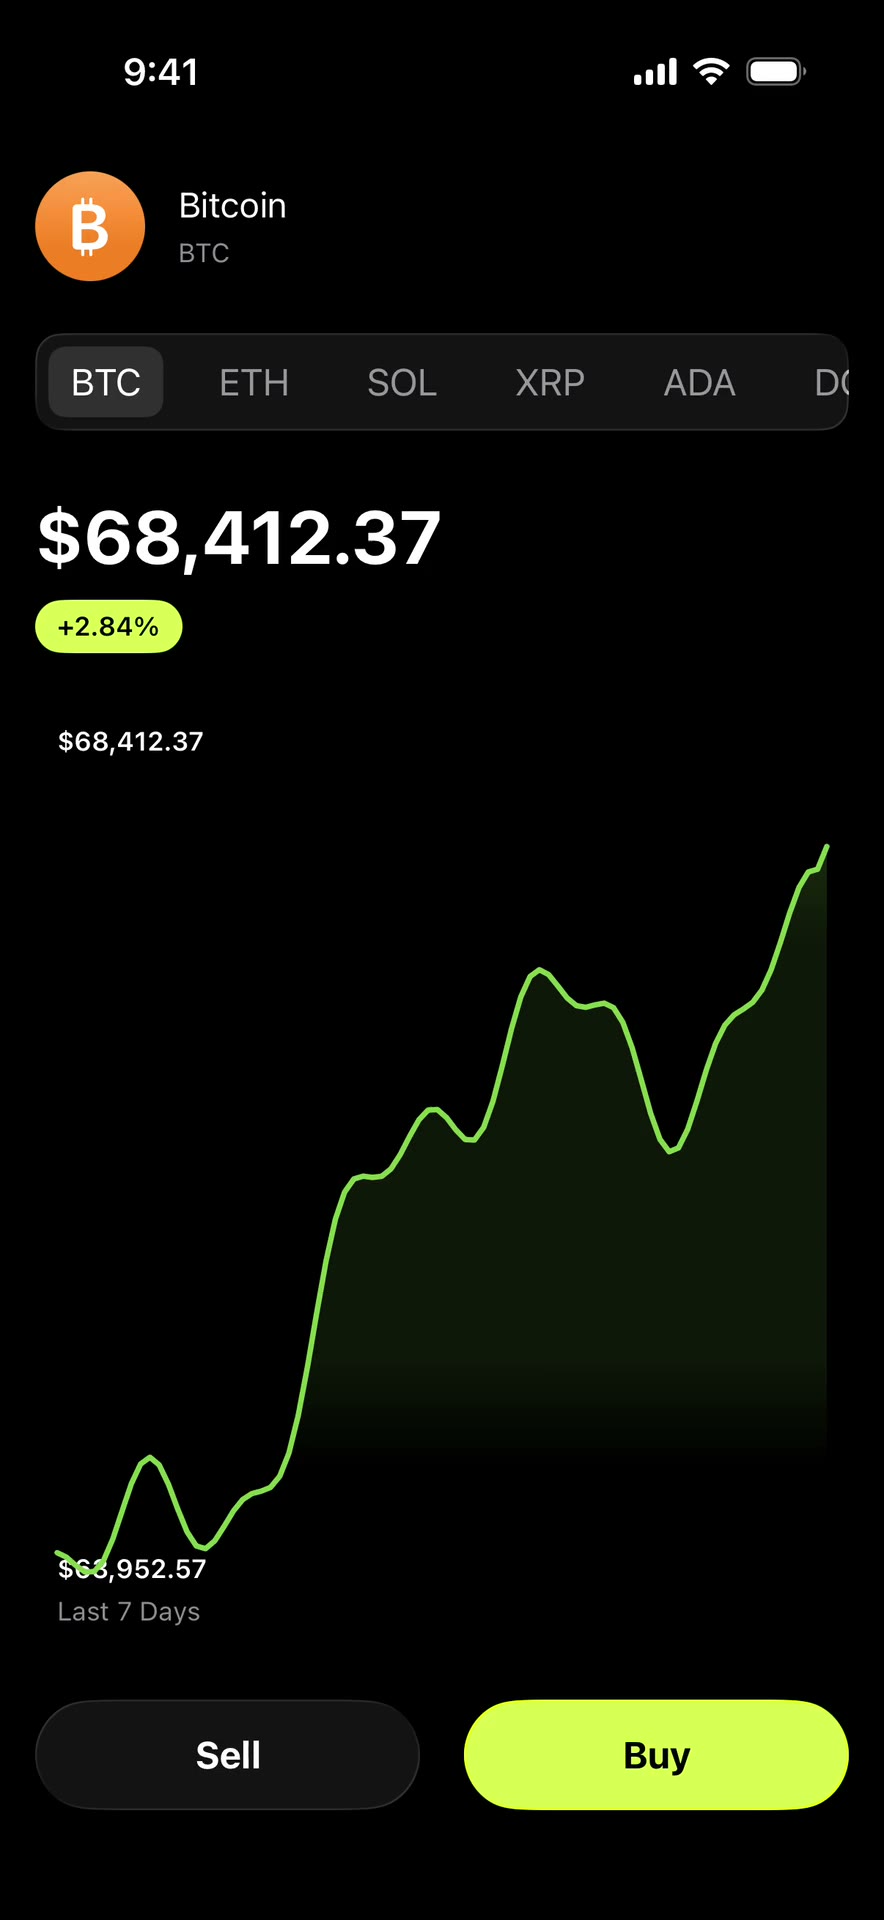
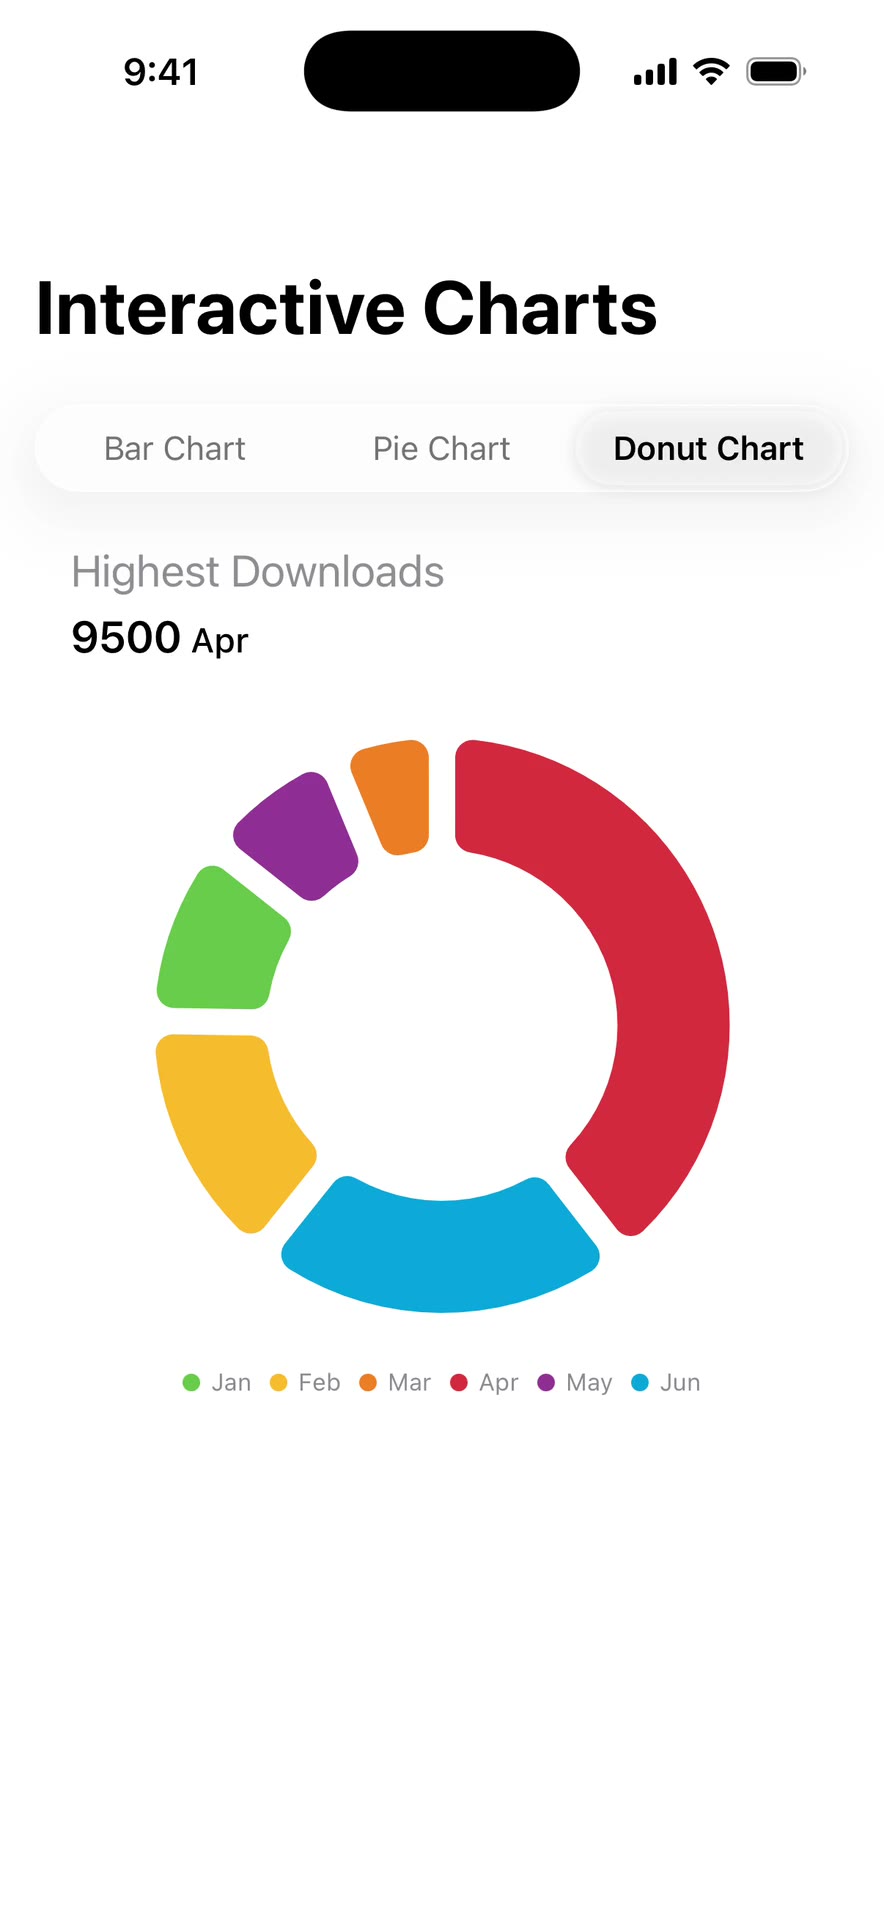
Slide your finger across a weekly bar chart to light up each day and see its value. Good for spend or stats pages.
- Requires
- iOS 18+
- APIs
- GeometryReader, Liquid Glass, sensoryFeedback
- Tags
- analytics, page, draggable, bar, graph, scrubbable, chart, charts, minimal, bold, drag, tap, haptics, spending, creator, stats, screen
Code
The code for this design comes with Swifolio Pro
$9.99/mo or $99/yr unlocks every design's source, .zip downloads and the MCP for Claude, ChatGPT and Cursor.
More like this